In this blog we will explore what Grafana is, how to proceed with the download and installation of Grafana and its plugins in Windows. We will then cover the pros and cons of Grafana, backed by an example using MySQL as the data source, to demonstrate how to create a custom Grafana dashboard, illustrating the use cases using the statistical data pulled out by writing MySQL queries.
Grafana is one of the best open source tools in the market for monitoring the applications which can be used for analyzing system failures, servers, business outcomes etc. It really does make our job easy by having to make only a few clicks like drag and drop, resizing, arranging panels and selecting the data within a period of time from the dashboard.
What is Grafana?
Grafana is an open source solution for running data analytics and visualization monitoring platforms with customizable dashboards. Grafana connects with every possible data source, some of the most used data sources such as Graphite, InfluxDB, Prometheus, Elasticsearch and Logz.io, MySQL, Amazon cloud watch.
Using Grafana we can provide several monitoring visualizations that combines metrics, logs and tracing data from different data sources into one single dashboard which can be exhibited in each individual panel and that panel can contain a graph, a Singlestat, a table, a heatmap, and freetext, and it can also integrate with both proprietary and community-created plugins too (like a clock or world map, for instance). We can also configure the alert functionality by sending the notifications through emails, slack or texts.
Install grafana in your local based on your OS using the below link:
Install on Windows | Grafana Labs
- Click Download the installer.
- Open and run the installer.
Note: The default Grafana port is 3000. This port might require extra permissions on Windows. If it does not appear in the default port, you can try changing to a different port.
- Go into the conf directory and copy sample.ini to custom.ini. Note: You should edit custom.ini, never defaults.ini.
- Edit custom.ini and uncomment the http_port configuration option (; is the comment character in ini files) and change it to something like 8080 or similar. That port should not require extra Windows privileges. Read more about the configuration options.
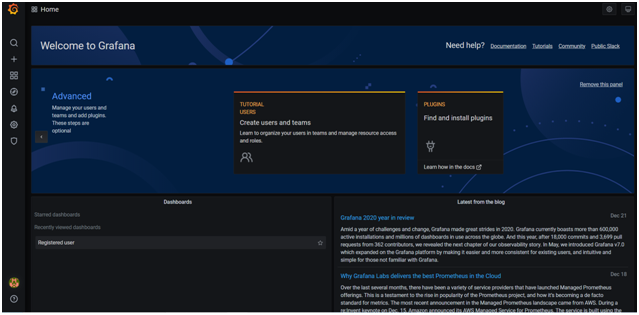
The default username and password is admin, admin. You can start the grafana in the local browser http://localhost:3000
Integrating MYSQL with grafana We need to add MYSQL as a data source:
- Go to settings->Configuration->Data sources-> Add data source->MySQL
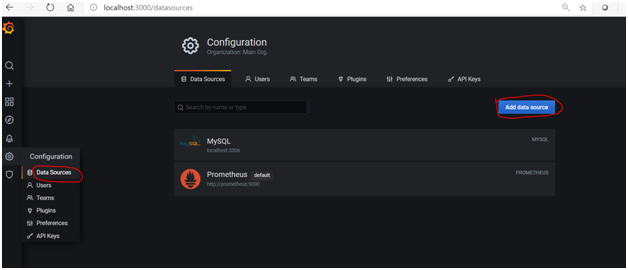
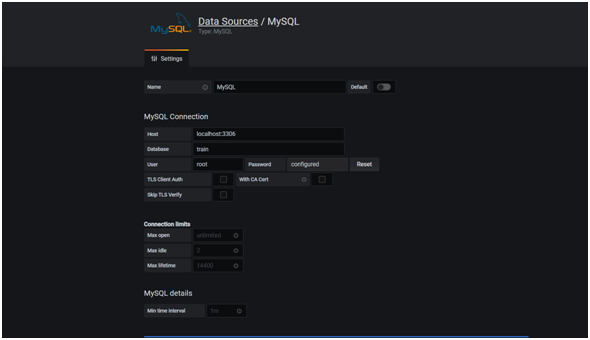
- Add the details for the connection like host, database, use and password and then click on Save & Test. Then MySQL will be added in the data source section.
- Create a panel to do the visualizations and save in dashboard
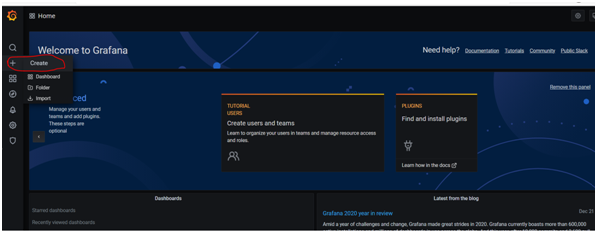
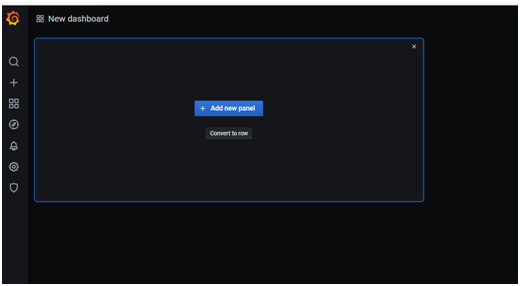
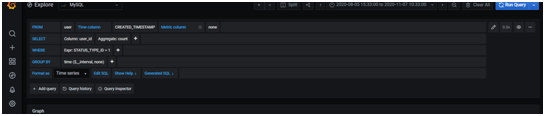
- Add new panel the below snippet will be displayed
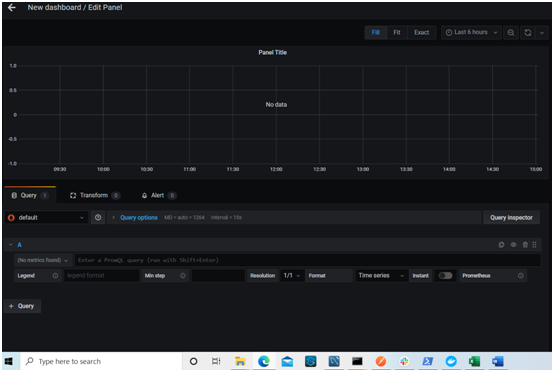
- We have to select MYSQL in the section below query
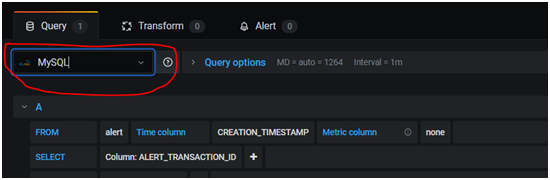
- As we have selected the required database all our tables in that database can be selected from drop down. We can select the required query as below.
The below details will display the number of registered user in the user table:
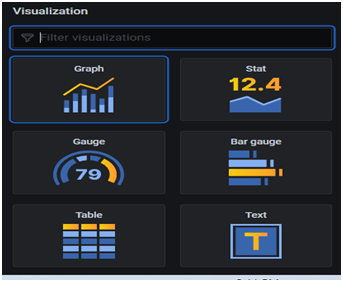
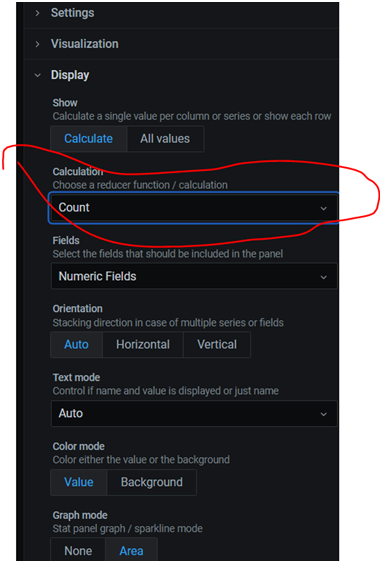
- We can choose the visualization mode from the side panel.
- We can use the different visualization mode as below:
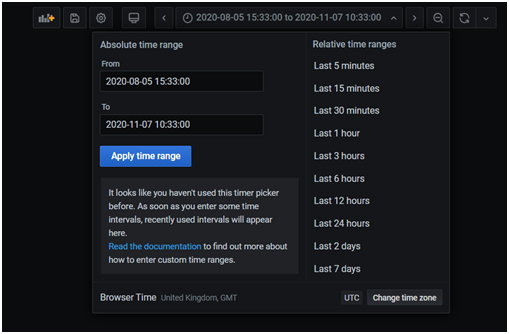
- You can add the time range and data related based on the time period as shown below
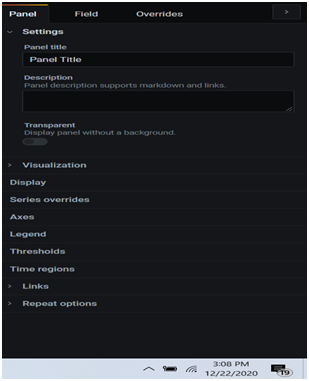
- You can add in display section->whether you need average,count etc
- Click on save
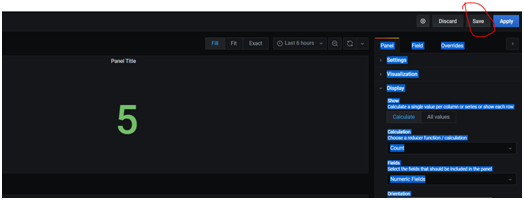
- Give the name of the visualization which has to be saved in the dashboard
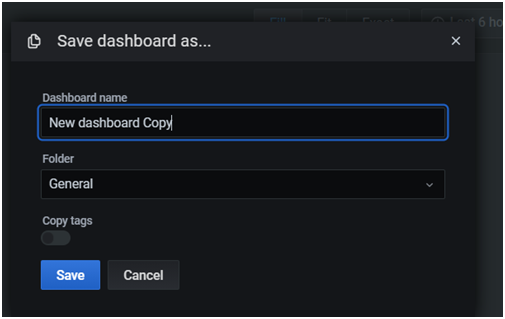
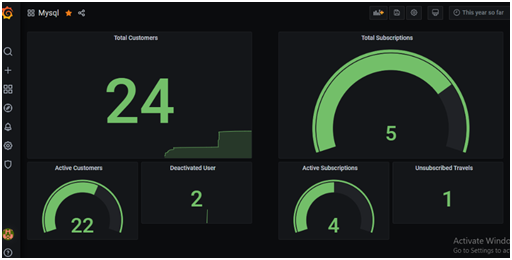
- You can save all the visualization in the dashboard and choose your visualization format
Adding community-created plugins:
We can download community created plugins from grafana plugins (here). We can add plugins as data sources, panels, apps which are not available in default installation. Some of the panels directly installed using grafana cli and alternatively we can download the zip file and extract the downloaded folder into grafana plugins directory and then those can be viewed in the dashboard.
Advantages of Grafana:
- Customizable dashboard interface, templating, annotations and good visual designs.
- Easy to connect almost every possible data source.
- Alert functionality to avoid risks/breakdowns.
Disadvantages of Grafana:
- Cannot send some custom queries to data source.
- A bit of time consuming on using filters
- Very less availability of plugins with default installation.